Today i read the first lines of a promising tutorial about machine learning. It starts introducing the subject and showing the first javascript example of classifier. I’ve never read anything about that, so my knowledge is still very limited (yes, I stopped before the end of the first lesson because I wanted to implement this). For technical details, I send you to the tutorial.
Anyway, what I’ve understood so far is that an important part of machine learning consists in classifiers. Classifiers are algorithm meant for “recognizing” (classify) objects by some of their features. Actually you feed them with a known dataset (already classified) and hope they will be able to classify any new object you throw in them by just recognizing their features and comparing them with the known features in the dataset. I won’t go technical on this (I can’t yet), I suggest you to read the linked tutorial if you’re really interested.
There are plenty of classifiers, but one of the simplest is the K Nearest Neighbour Classifier.It works just by representing the n features (which must be numeric) on the axis of a n-dimensional space. When you give it an element to classify, it finds the K nearest known elements (of the given dataset) and finds which class occurs most of the times in this K elements. The element is then assumed to belong to this class, and thus is classified.
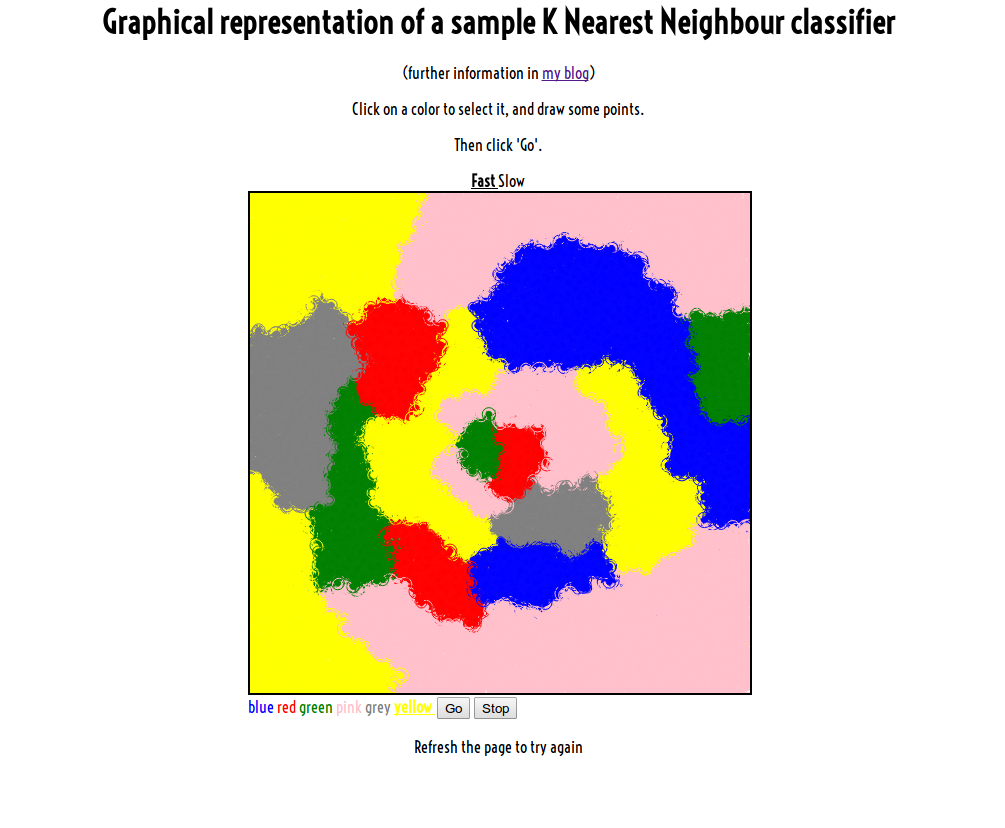
I wanted to try to implement my own version of this simple algorithm, so I wrote this little Javascript app which takes some input points (x and y are the numeric features), each of them with a color (the known class), and then generates new random elements (x and y) and classifies them with the K Nearest Neighbour (with K=5 for now, but i’m changing that often), coloring the points (putting them in a class). The result is, after some time, that the entire space is colored in a way dependent by the dataset (your original input). That’s not much useful, but it’s surely funny. At least it has been for me.
Notice that this implementation uses as dataset of the current step every element in the canvas, even those generated randomly and then classified in previous steps. This is of course not very clever for this kind of classifier, but it makes the result less predictable, and fits better my purposes (I have no purposes).
Here’s the link, and here’s a screenshot:

